

Benchmarks are average performance numbers from thousands of campaigns across different industries, regions, and audience types. When you compare your results against these averages, you get a clear picture of where you stand. Are your open rates healthy? Is your click-through rate too low? Are you losing subscribers faster than you should?
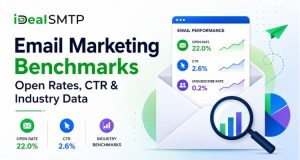
This blog breaks down the most important email marketing benchmarks you need to track in 2026. We will go through each major metric, explain what a good number looks like, and tell you what steps you can take if your results are falling behind. Whether you are a small business owner managing your own campaigns or a marketer working for a bigger brand, these numbers will help you make smarter decisions.
The goal here is simple: to give you real, useful information so you can correctly assess your email marketing performance metrics and improve them step by step.
Email is still one of the most reliable marketing channels out there. It gives you direct access to your audience without depending on any algorithm. But to get the most out of it, you need to understand what good performance looks like. That is what email marketing industry benchmarks are for.
Table of Contents
What are Email Marketing Benchmarks and Why Do They Matter
Before jumping into numbers, let us be clear about what benchmarks actually are and why you should care about them.
An email marketing benchmark is a standard performance value measured across a large number of campaigns. Email service providers, marketing research companies, and industry groups usually publish these values. They tell you the average open rate, click rate, bounce rate, and other key metrics across different sectors.
Think of benchmarks like a report card average. If the class average on a test is 70 marks and you scored 65, you know you are slightly below average. But if you scored 80, you know you are doing well. Benchmarks work the same way for your email campaigns.
Here is why they matter in practice:
When you track your email marketing performance metrics without any reference point, you are basically guessing. You might think a 20% open rate is bad, but for your industry, it could actually be above average. Or you might feel satisfied with a 1% click rate without realizing that your competitors are getting 3% to 4% regularly.
Benchmarks give you that reference point. They help you set realistic goals, identify what is working and what is not, and prioritize where to invest your time and budget.
Also, if you are reporting results to a client or a team, benchmarks help you tell the story clearly. You are not just saying, “We got a 25% open rate” – you are saying, “We got a 25% open rate, which is above the industry average of 21%.” That is a much more useful statement.
Another reason benchmarks matter is that they change over time. As inboxes get more crowded and people become more selective about what they read, average open rates and click rates shift. Staying updated with current email marketing industry benchmarks helps you adapt your strategy instead of relying on outdated assumptions.
Read Also: Email Spam Checker- 8 Tools Ensure Emails Land in the Inbox
Key Email Marketing Benchmarks You Should Know in 2026
Let us now look at the actual numbers. These are the major metrics that every email marketer should track and compare.
Open Rate
The open rate tells you what percentage of recipients opened your email. As of 2026, the average open rate across industries sits between 21% and 26%. However, this number varies a lot by sector.
For example, emails in the education and non-profit sectors tend to see higher open rates – sometimes above 30%. Retail and e-commerce emails generally hover around 18% to 22%. If your open rate is below 15%, that is a signal worth investigating. It could mean your subject lines need work, your list has gone stale, or your emails are landing in spam.
Click-Through Rate (CTR)
CTR measures how many people clicked on a link inside your email. The benchmark email marketing average for CTR is around 2% to 3%. Some high-performing B2B campaigns reach 4% to 5%, while broad promotional emails to cold or large lists often see less than 1%.
A low CTR usually means one of two things: either the email content is not connecting with the reader, or your call-to-action is not clear enough. Sometimes it is both.
Click-to-Open Rate (CTOR)
This is a more precise metric than CTR alone. It compares the number of clicks against only those who actually opened the email. A healthy CTOR sits between 10% and 15%. This metric tells you how effective your email body and content are – once someone opens it, are they engaging with what is inside?
Unsubscribe Rate
A high unsubscribe rate is a warning sign. The standard benchmark is below 0.5% per campaign. If you are consistently seeing 1% or higher, your content may not be matching what subscribers expected when they signed up. Frequency can also be an issue – too many emails too quickly push people away.
Bounce Rate
There are two types of bounces: hard and soft. Hard bounces happen when an email address does not exist. Soft bounces are temporary delivery failures. Your hard bounce rate should stay below 2%. Anything higher affects your sender reputation and can lead to your emails being filtered as spam.
Spam Complaint Rate
This one is serious. A spam complaint rate above 0.08% starts triggering warnings with major inbox providers like Gmail and Outlook. Keep this number as close to zero as possible. Regular list cleaning and proper opt-in practices are the best ways to manage this.
Read More: SMTP Authentication, How to Configure It for Better Email Security
How Email Marketing Benchmarks Differ by Industry
One thing many marketers get wrong is comparing their numbers to a general average without considering their industry. Email marketing campaign statistics show very clearly that performance varies significantly from one sector to another.
Here is a look at how benchmarks shift across different industries:
Healthcare and Wellness
Healthcare emails tend to get higher engagement because the content is personal and relevant. Open rates in this space often reach 23% to 28%. People care about their health, so relevant content gets read. However, marketers in this space need to be careful about privacy and compliance, which can limit the type of messaging they can use.
E-commerce and Retail
This is one of the highest-volume email categories. Because of that, open rates are typically lower, around 17% to 22%. But click rates can be stronger because product-focused emails with clear CTAs drive direct action. Promotional emails, cart abandonment sequences, and post-purchase follow-ups all perform differently within this sector.
B2B and SaaS
B2B email tends to have smaller lists but higher intent. Open rates here often range from 22% to 30%, especially for newsletters and product updates going to subscribed professionals. CTR can also be higher because the audience is more targeted. Email marketing strategy in the B2B space usually focuses on nurturing leads over time rather than pushing immediate sales.
Real Estate
Real estate emails often see above-average open rates because the audience is either actively buying, selling, or researching. Open rates of 24% to 28% are common. However, list quality is critical; outdated contacts in real estate can quickly inflate your bounce rate.
Travel and Hospitality
This industry saw a significant drop during 2020 and 2021 but has bounced back. Open rates for travel emails now sit around 20% to 25%. Seasonal campaigns and personalized travel recommendations tend to outperform generic promotional blasts.
Education
Education emails – both for schools and online learning platforms – consistently show some of the strongest engagement. Open rates above 28% are not unusual. The audience tends to be curious and motivated, which helps.
The point here is this: before you judge your own campaign numbers, check what the benchmark is for your specific industry. A 19% open rate might be perfectly healthy for your niche, even if the overall average is higher.
Read Also: Complete DNS Setup for Email Servers, Step-by-Step Guide for Better Email Deliverability
How to Improve Your Email Marketing Performance Metrics
Knowing the benchmarks is only half the job. The other half is using that knowledge to make your campaigns better. Here are practical steps you can take based on common problem areas.
If Your Open Rate Is Low
Start with your subject line. It is the first thing people see and the biggest driver of whether they open or ignore your email. Keep subject lines short, specific, and useful. Avoid clickbait – it might boost opens once but kills trust quickly.
Also, check your sender name. People open emails from names they recognize. If you are sending from a generic company name, try using a real person’s name combined with the brand. “Ravi from iDealSMTP” often performs better than just “iDealSMTP.”
List hygiene matters too. Remove invalid addresses, re-engage inactive subscribers with a reactivation campaign, and remove those who do not respond. A smaller, active list almost always outperforms a large, disengaged one.
If Your CTR Is Low
Look at your email content and your call-to-action. Is it clear what you want the reader to do next? One email should have one primary goal. Too many links and offers split the reader’s attention and reduce clicks overall.
Also consider your email design and layout. On mobile, buttons need to be large enough to tap easily. If your email looks cluttered or loads slowly, people leave before clicking anything.
Segmentation also plays a big role. Sending the same email to your entire list rarely performs as well as sending targeted messages to smaller, more specific groups based on behavior, location, or interest.
If Your Unsubscribe Rate Is High
This usually points to a mismatch between what subscribers expected and what they are receiving. When someone signs up, your welcome email should clearly set expectations – how often you will email and what kind of content to expect.
Also, look at frequency. If you are emailing daily and your content does not justify that cadence, people will leave. Test reducing your frequency and see if it makes a difference.
If Your Bounce Rate Is High
The most common cause is a poor-quality list. If you bought contacts, used scraped emails, or have not cleaned your list in a long time, your bounce rate will suffer. Use an email validation tool to clean addresses before sending. Most good email platforms will flag or remove invalid addresses automatically over time.
Read Also: Email Segmentation Strategies That Instantly Boost Open Rates
Email Deliverability and Its Role in Benchmark Performance
One area that does not get enough attention in benchmark discussions is deliverability. Even the best email content does no good if it never reaches the inbox.
Deliverability is about whether your emails actually land in the primary inbox, the promotions tab, or the spam folder. Your email marketing campaign statistics will look completely different depending on where your emails land.
There are a few technical elements that directly affect deliverability:
SPF, DKIM, and DMARC – These are authentication protocols that prove to inbox providers that your emails are legitimate. If these are not set up correctly, your emails are at risk of being filtered or rejected entirely.
Sender Reputation – Every sending domain and IP address has a reputation score. Sending to bad addresses, getting spam complaints, or using a new domain without a warm-up period all hurt your reputation. A good reputation means better inbox placement, which directly improves your open rates.
Email Warm Up – If you are using a new email domain or IP, do not send large volumes immediately. Start with smaller batches and increase gradually. This builds trust with inbox providers and protects your sender reputation from the start.
List Engagement – Inbox providers like Gmail pay attention to how recipients interact with your emails. If a large portion of your list never opens your emails, Gmail may start routing your messages to spam. Regularly removing unengaged subscribers helps maintain good deliverability.
Paying attention to deliverability is not optional; it is foundational. If you are not in the inbox, no benchmark in the world can help you.
Benchmark Email Marketing: Best Practices to Stay Competitive
Understanding email marketing industry benchmarks is useful, but your real goal should be to beat the average in your sector consistently. Here are a few practices that high-performing email programs follow:
Personalization – Emails that use the recipient’s name, location, or past behavior tend to get 15% to 30% higher open rates. It does not have to be complex. Even basic personalization makes a difference.
A/B Testing – Always test one variable at a time. Test subject lines, send times, CTA text, or email length. Over time, this data builds up and gives you a clear picture of what your specific audience responds to.
Send Time Optimization – While general benchmarks suggest Tuesday and Wednesday mornings perform well for B2B, this can vary. Use your platform’s analytics to find when your audience is most active and test different send times.
Responsive Design – More than 60% of emails are now opened on mobile devices. If your email does not display correctly on a phone, you are losing a significant portion of your potential engagement before readers even finish reading.
Consistent Sending Schedule -Sporadic sending hurts both engagement and deliverability. When you email on a predictable schedule, subscribers get used to hearing from you and are more likely to open regularly.
Read Also: 5 Strategies Increase Email Open Rates Bulk Email Campaigns
Conclusion
Email marketing remains one of the most cost-effective digital channels available today. But to use it well, you need more than just creativity and good writing. You need data. Benchmark email marketing data is the most grounded reference you can use.
In this blog, we covered what email marketing benchmarks are and why they matter, the major email marketing performance metrics, including open rate, CTR, CTOR, bounce rate, and spam complaint rate, how performance differs across industries, practical steps to improve your numbers, and why deliverability is the foundation on which everything else rests.
The key takeaway is this: do not evaluate your campaigns in isolation. Always compare against your industry’s email marketing industry benchmarks, track changes over time, and focus on incremental improvement rather than chasing one big jump.
Email marketing campaign statistics show that brands that consistently monitor and act on benchmark data outperform those that send campaigns and hope for the best. Small improvements in open rates, click rates, and list hygiene compound over time into much better results.
Frequently Asked Questions
Here are some important FAQs to help you better understand email marketing benchmarks.
1. What is a good open rate for email marketing in 2026?
A good open rate depends on your industry, but the general benchmark sits between 21% and 26%. For B2B and education sectors, rates above 28% are achievable. If you are below 18%, focus on improving subject lines and list quality first.
2. How do I calculate my email click-through rate?
Divide the number of unique clicks by the number of emails delivered, then multiply by 100. For example, 300 clicks from 10,000 delivered emails gives you a 3% CTR, which is in line with the standard benchmark email marketing average.
3. Which email marketing platform gives the best deliverability?
Platforms like SMTPmart, Mailchimp, ActiveCampaign, and SendGrid are known for strong deliverability. The right choice depends on your volume, budget, and technical requirements. Always check their reputation for inbox placement rates before committing.
4. How often should I send marketing emails to my list?
For most businesses, once or twice a week works well without burning out your audience. High-value content can justify more frequent sending, but always watch your unsubscribe rates as a signal. For transactional emails, send only when triggered by a user action.
5. What unsubscribe rate is considered too high?
Anything consistently above 0.5% per campaign is a warning sign. It usually means your content is not matching subscriber expectations, or your sending frequency is too high. Fix the mismatch before your list shrinks too fast.
6. Does buying an email list affect my benchmark performance?
Yes, significantly. Purchased lists typically contain outdated or invalid addresses, which drives up bounce rates and spam complaints. This damages your sender reputation and tanks your overall email marketing performance metrics. Always use opt-in lists.
7. How do I reduce my email spam complaint rate?
Use confirmed opt-in processes, make the unsubscribe button easy to find, and only email people who genuinely asked to hear from you. Relevant, useful content also reduces complaints because people do not mark emails as spam when they find them valuable.
8. What is the difference between hard bounce and soft bounce in email marketing?
A hard bounce means the email address does not exist or is permanently invalid. A soft bounce is a temporary failure, like a full inbox. Hard bounces must be removed from your list immediately. Soft bounces can be retried but should be removed if they keep failing.
9. How do I improve my email deliverability for better benchmark results?
Set up SPF, DKIM, and DMARC authentication on your sending domain. Warm up new IPs gradually. Clean your list regularly. Avoid spam-trigger words in subject lines. Maintain a healthy engagement rate by removing chronically inactive subscribers.
10. Is email marketing still profitable in 2026 compared to social media?
Email marketing continues to deliver strong returns, with most studies showing an average ROI of around 36 to 40 dollars for every dollar spent. Unlike social media, email is not subject to algorithm changes, and you own your list. For businesses selling products or services online, email remains one of the highest-converting channels available.